���������������������������������������������������������������������������������������������������������������������������������������������������������������������������������������������������������������������������������������������������������������������������������������������������������������������������������������������������������������������������������������������������������������������������������������������������������������������������������������������������������������������������������������������������������������������������������������������������������������������������������������������������������������������������������������������������������������������������������������������������������������������������������������������������������������������������������������������������������������������������������������������������������������������������������������������������������������������������������������������������������������������������������������������������������������������������������������������������������������������������������������������������������������������������������������������������������������������������������������������������������������������������������������������������������������������������������������������������������������������������������������������������������������������������������������������������������������������������������������������������������������������������������������������������������������������������������������������������������������������������������������������������������������������������������������������������������������������������������������������������������������������������������������������������������������������������������������������������������������������������������������������������������������������������������������������������������������������������������������������������������������������������������������������������������������������������������������������������������������������������������������������������������������������������������������������������������������������������������������������������������������������������������������������������������������������������������������������������������������������������������������������������������������������������������������������������������������������������������������������������������������������������������������������������������������������������������������������������������������������������������������������������������������������������������������������������������������������������������������������������������������������������������������
Creating a Redshift Cluster
In this tutorial, we will see how you can create a new Redshift cluster
Cluster setup
After logging in to your AWS console, navigate to Redshift Dashboard page to get started:
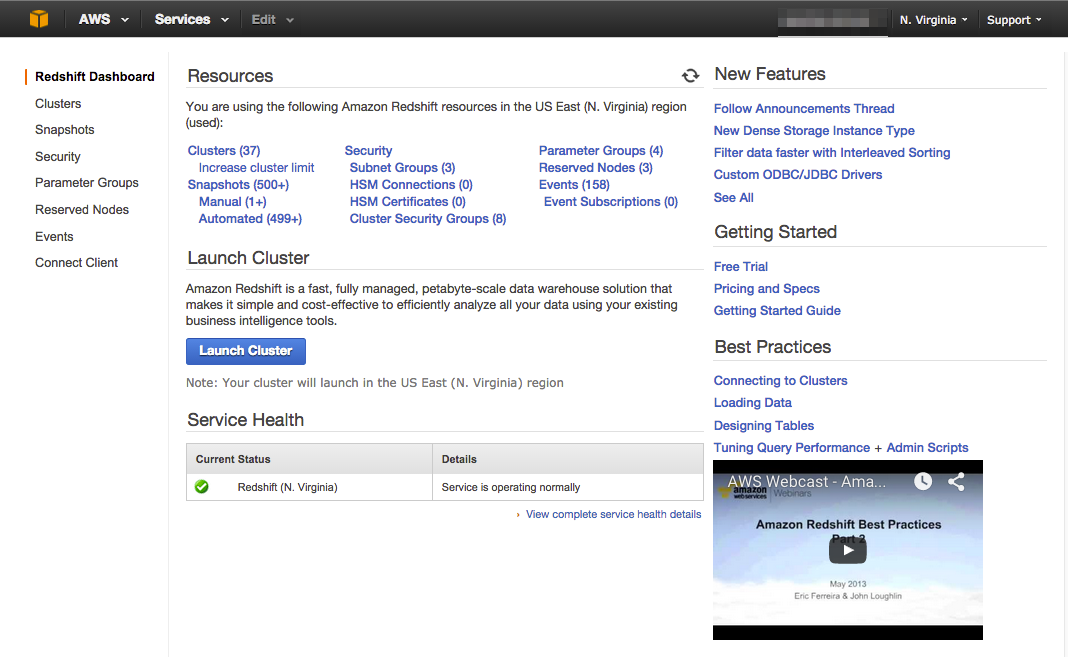
Click on the Lauch Cluster button on the Dashboard to create a new cluster. After clicking on the Launch Cluster button, you will be redirected to the Cluster detail screen.
Cluster Details
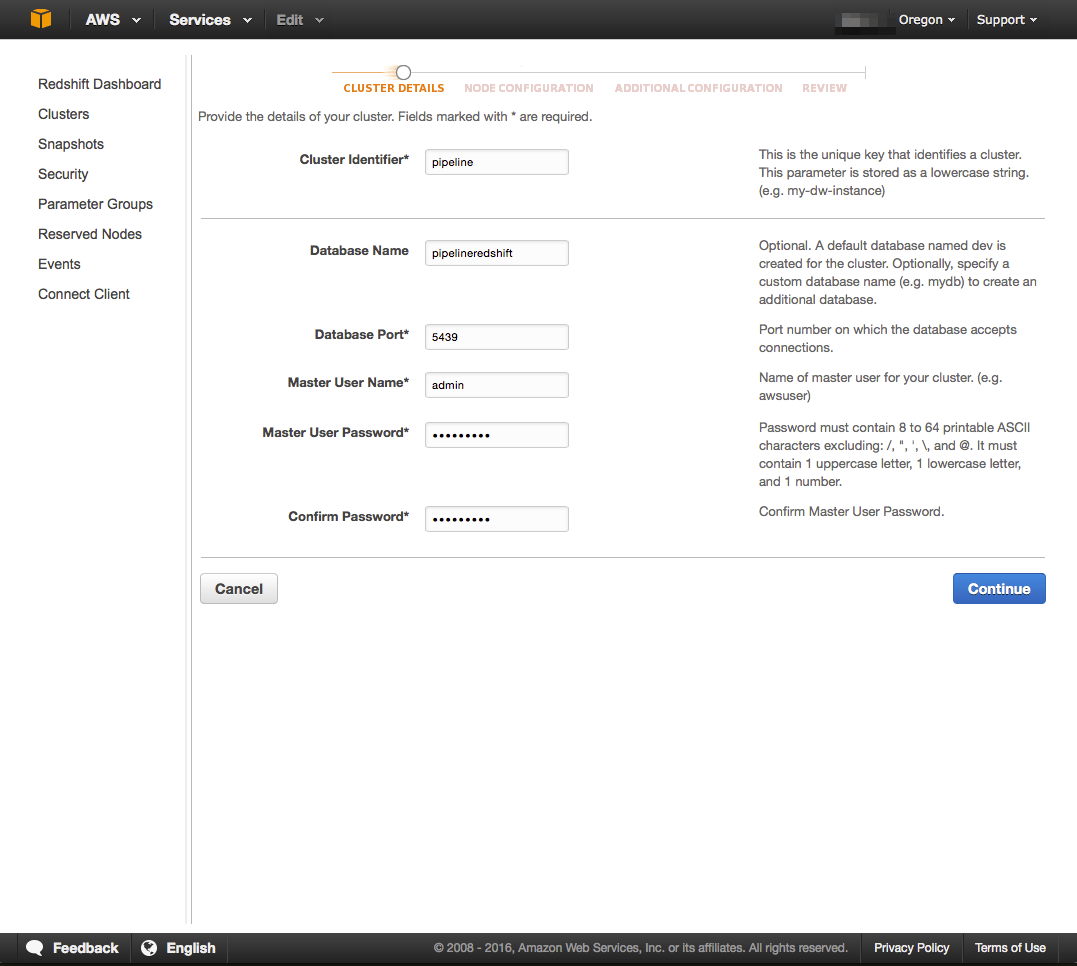
Specify the following details to complete the form:
- Cluster Identifier: Provide a unique name to your cluster. This cluster name will be used to refer to this cluster from Ideata.
- Database Name: Specify a database name which you wish to use with Ideata to import data to.
- Database Port: Specify the port on which Redshift will be available for connection. This port will be used while connecting to Redshift from Ideata.
- Master User Name: Specify a username that will be used to connect to the Redshift instance.
- Master user password and Confirm Password: Password that will be used to connect to Redshift.
Click Continue to proceed to the next section of selecting node and cluster details.
Node Configuration
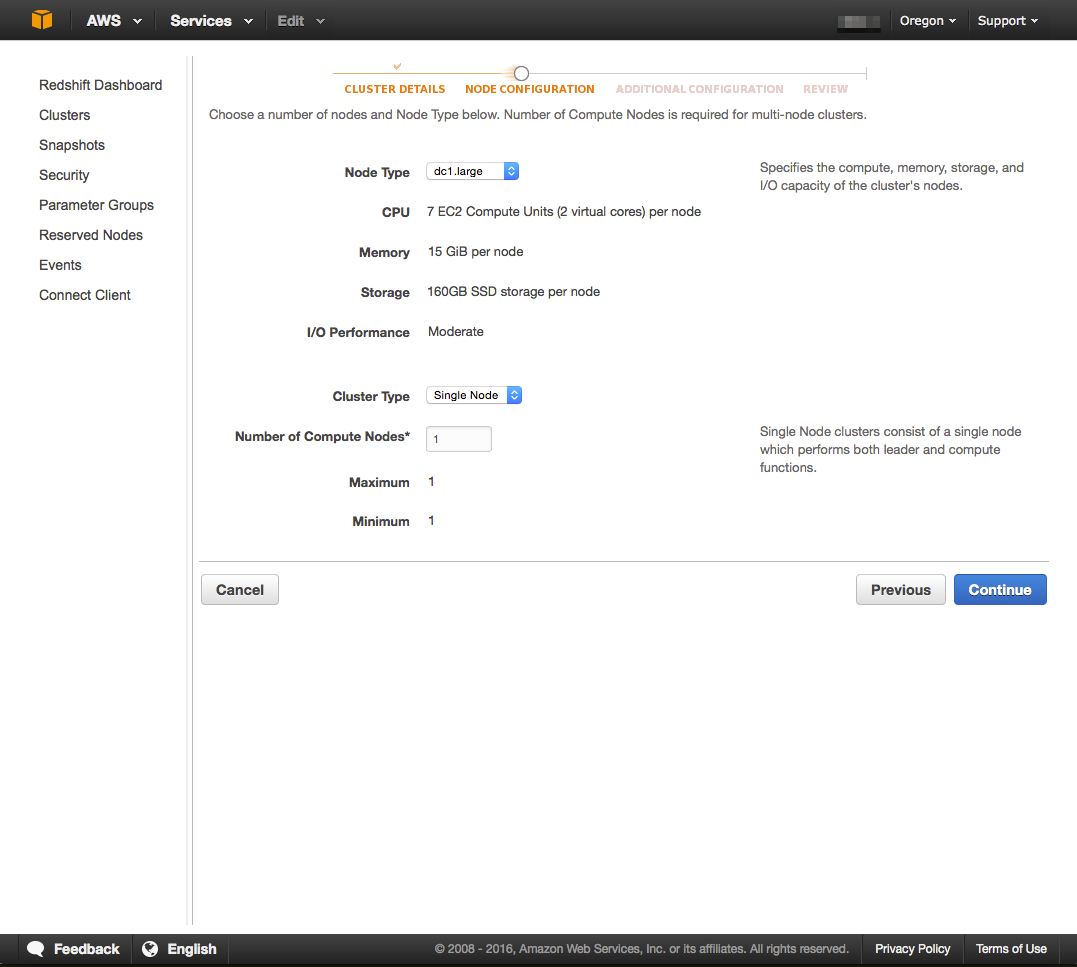
Node configuration screen allows users to specify the type of cluster they would like to create on Redshift. Provide the following details to complete the form:
- Node Type: AWS Node type code that you can use want to use for creating the Redshift cluster. Refer to the AWS Redshift home page to select the node type that suits your requirements: https://aws.amazon.com/redshift/pricing/#On-Demand\_Pricing
- Cluster Type: Select the cluster type that you would want to create. Single Node for starting a single node Redshift cluster, Multi-Node for multi node cluster.
- Number of Compute Nodes: Number of nodes that you choose depends on the size of your dataset and your desired query performance.
Click Continue to proceed to the next section.
Additional Configuration
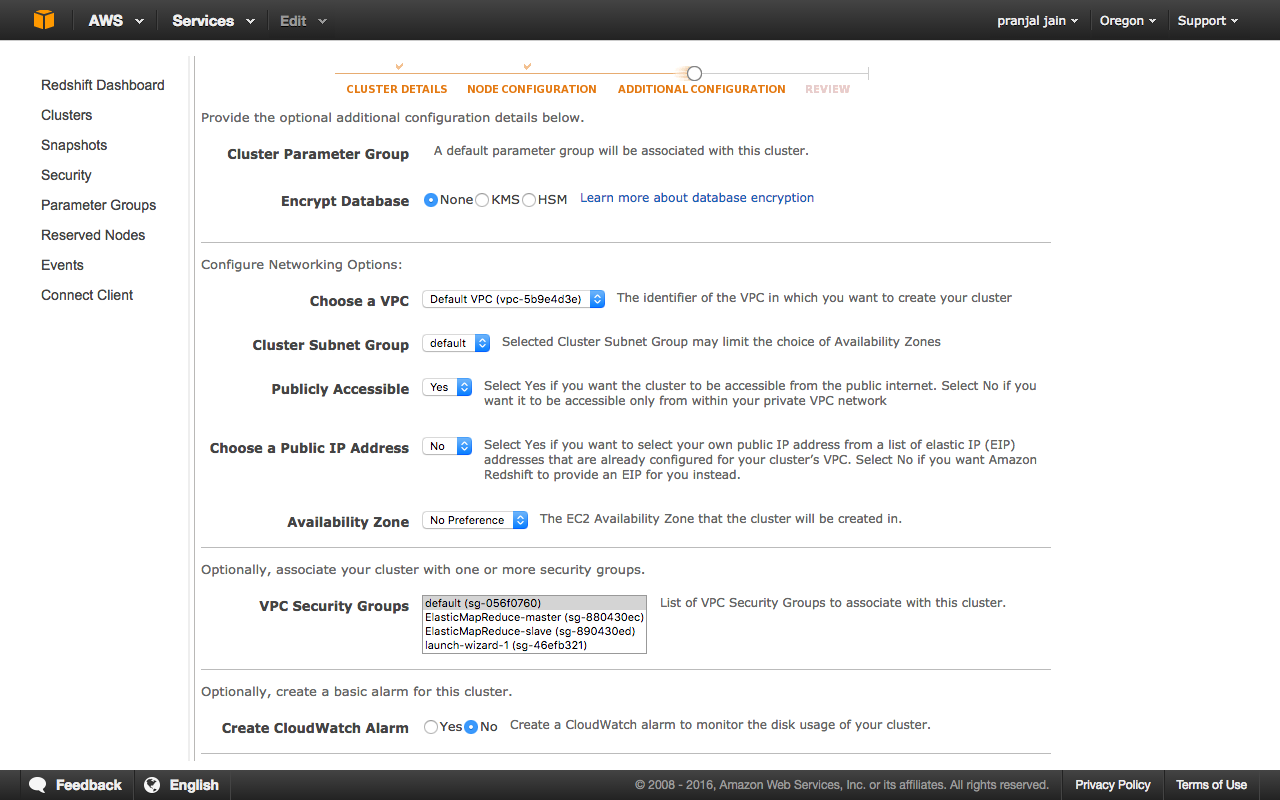
Additional configuration allows you to configure a parameter group and encryption setting, set your networking options, and associate a security group with your Redshift cluster. For this tutorial we will use most of the default settings and provide the following details to setup the cluster.
For advanced settings please refer to Getting started with Amazon VPC, and Amazon Redshift Parameter Groups
Cluster Review
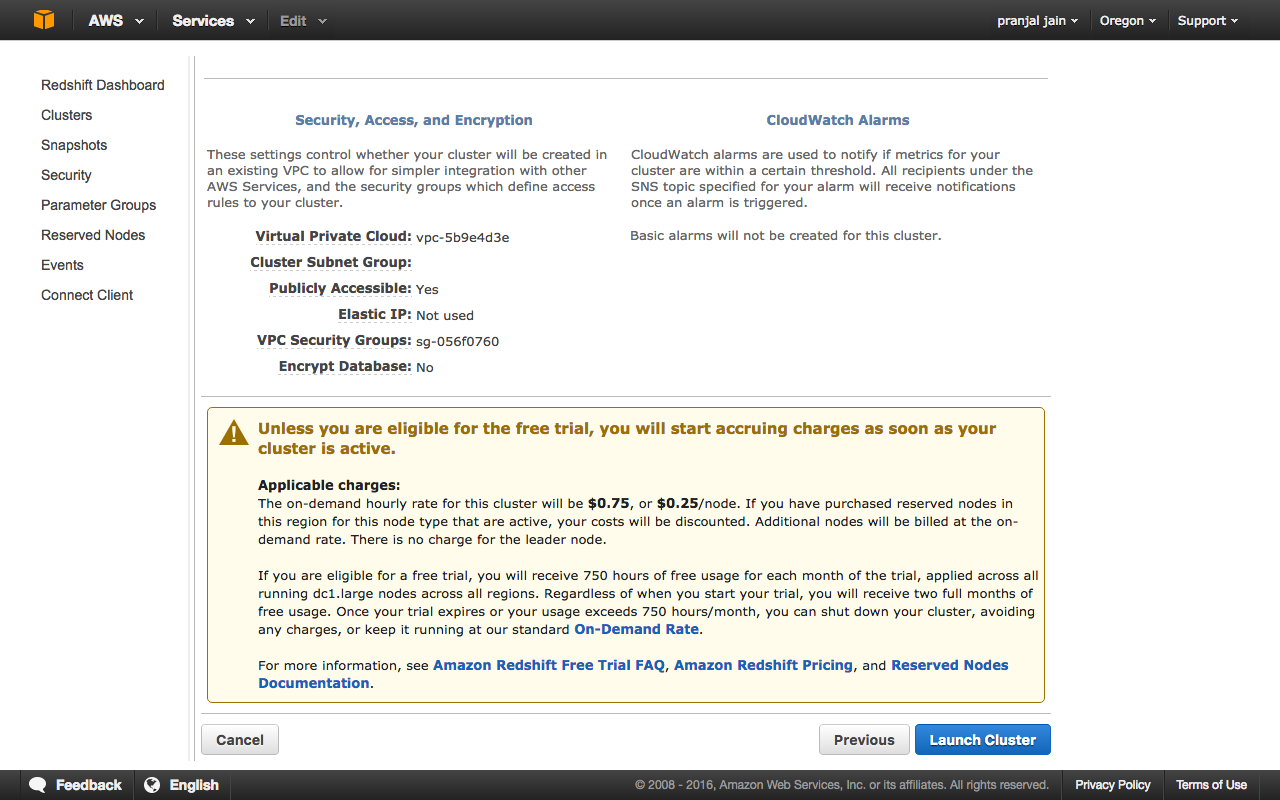
Review the details of your Redshift cluster and click on Launch Cluster to create your Redshift Cluster.